Shifting Gears: Citi Bike Recovers Faster Than Subway
This post is part of our comprehensive look at how COVID-19 is reshaping the mobility landscape. For more original research, project work, and thought leadership from the Sam Schwartz team, visit the Covid-19 Response + Analysis center.
By the Sam Schwartz Data Analytics Team: Yana Chudnaya, PE, Matthew Dwyer, and Daniel Schack, AICP
It has been widely reported that overall mobility plummeted at the onset of the COVID-19 pandemic but, as New York begins its recovery, a major shift in residents’ movements is occurring. New data sheds light on the story of how many New Yorkers have forgone their subway rides, causing the subway ridership recovery to stagnate, while others have opted for bike share, with recreational trips bolstering a rebound of Citi Bike ridership to nearly pre-pandemic levels.
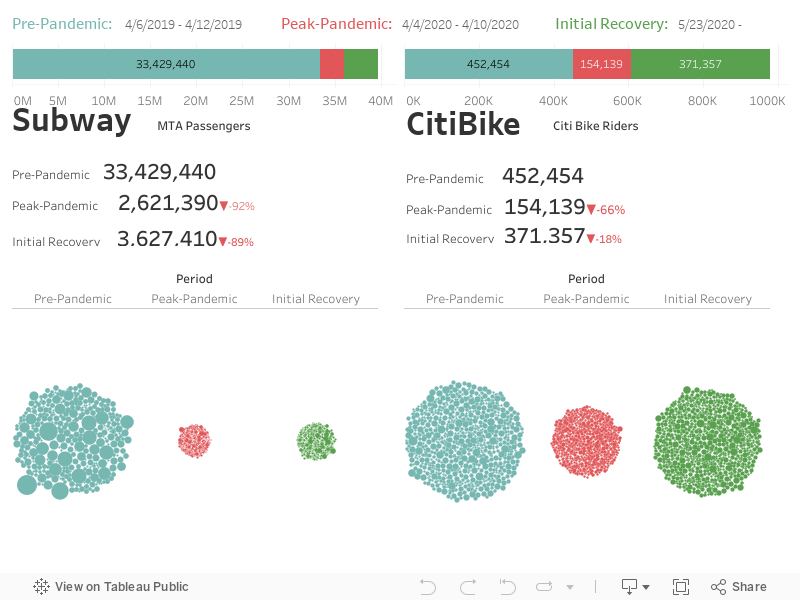
Swiftly and dramatically, the pandemic brought New York City to a halt. Subway ridership fell 92%, from 33 million to 2.6 million rides per week, and Citi Bike ridership fell 66%, from 450,000 to 150,000 rides per week at the peak of the pandemic. Why did Citi Bike ridership quickly rebound to just 18% below pre-pandemic levels during Phase I of reopening, while subway ridership remained 89% below pre-pandemic levels?
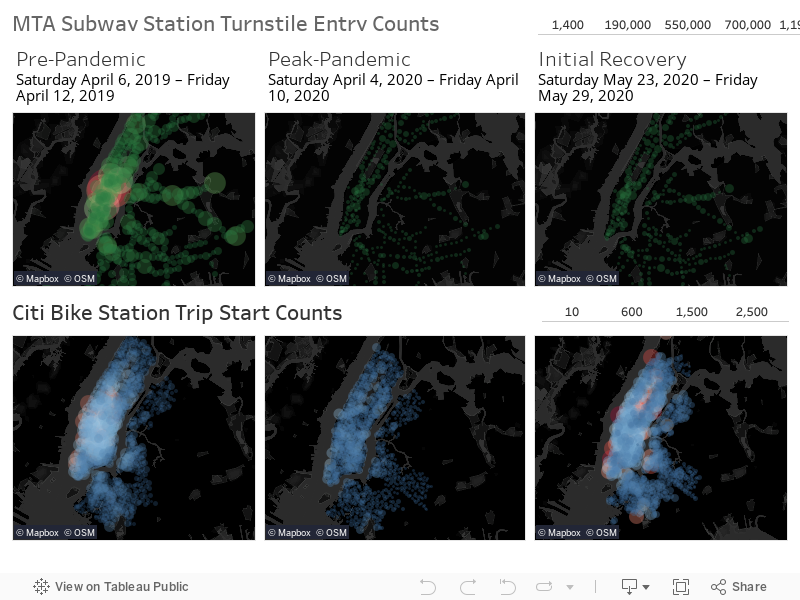
The Sam Schwartz data analytics team looked to big data to understand the details of the recovery. The interactive maps below display trip origin locations for the subway and Citi Bike pre-pandemic, peak-pandemic, and during the initial recovery period in late Spring 2020.
Mobility Choices Have Changed
The subway system was the most-used travel mode pre-pandemic, with Times Square, Grand Central-42nd St, and 34th St-Penn Station as the three busiest stations. Before COVID-19, Times Square station alone saw an astonishing 1.2 million weekly riders. Citi Bike ridership, however, was always more evenly distributed across many stations (although it covers just a portion of the area the subway system does).
How did the pandemic shift the behavior of users? On the subway, while overall ridership has significantly dropped, the distribution of riders has only changed in some ways: the stations named above remain amongst the busiest in the system while other stations in Queens and Upper Manhattan, likely where a large concentration of essential workers live, have entered the top ten. Citi Bike tells a more extreme story: the previous concentration of trips in Midtown Manhattan has now dispersed significantly to other areas.
Further illustrating these shifting mobility patterns, the bubble diagrams below display both overall ridership of the subway and Citi Bike, and individual station usage. While overall subway trips remain nearly as low as peak-pandemic levels, individual station distribution is relatively unchanged. In comparison, overall Citi Bike trips during initial recovery (in green) are nearly as high as pre-pandemic levels (in blue), and individual station usage has shifted dramatically. The graphic below is interactive so you can explore the data in detail; each bubble represents weekly customers at different stations.
Recreation Trips Driving Citi Bike Recovery
To assess why these two modes are recovering in such different ways, we dug further into the ridership data and examined the temporal distribution of trips, as well as the geographic distribution. Looking at the trip time information revealed that likely explanation for the drastically different patterns is that even within the initial recovery, most trips are being made for what appears to be recreational purposes, not commuting.
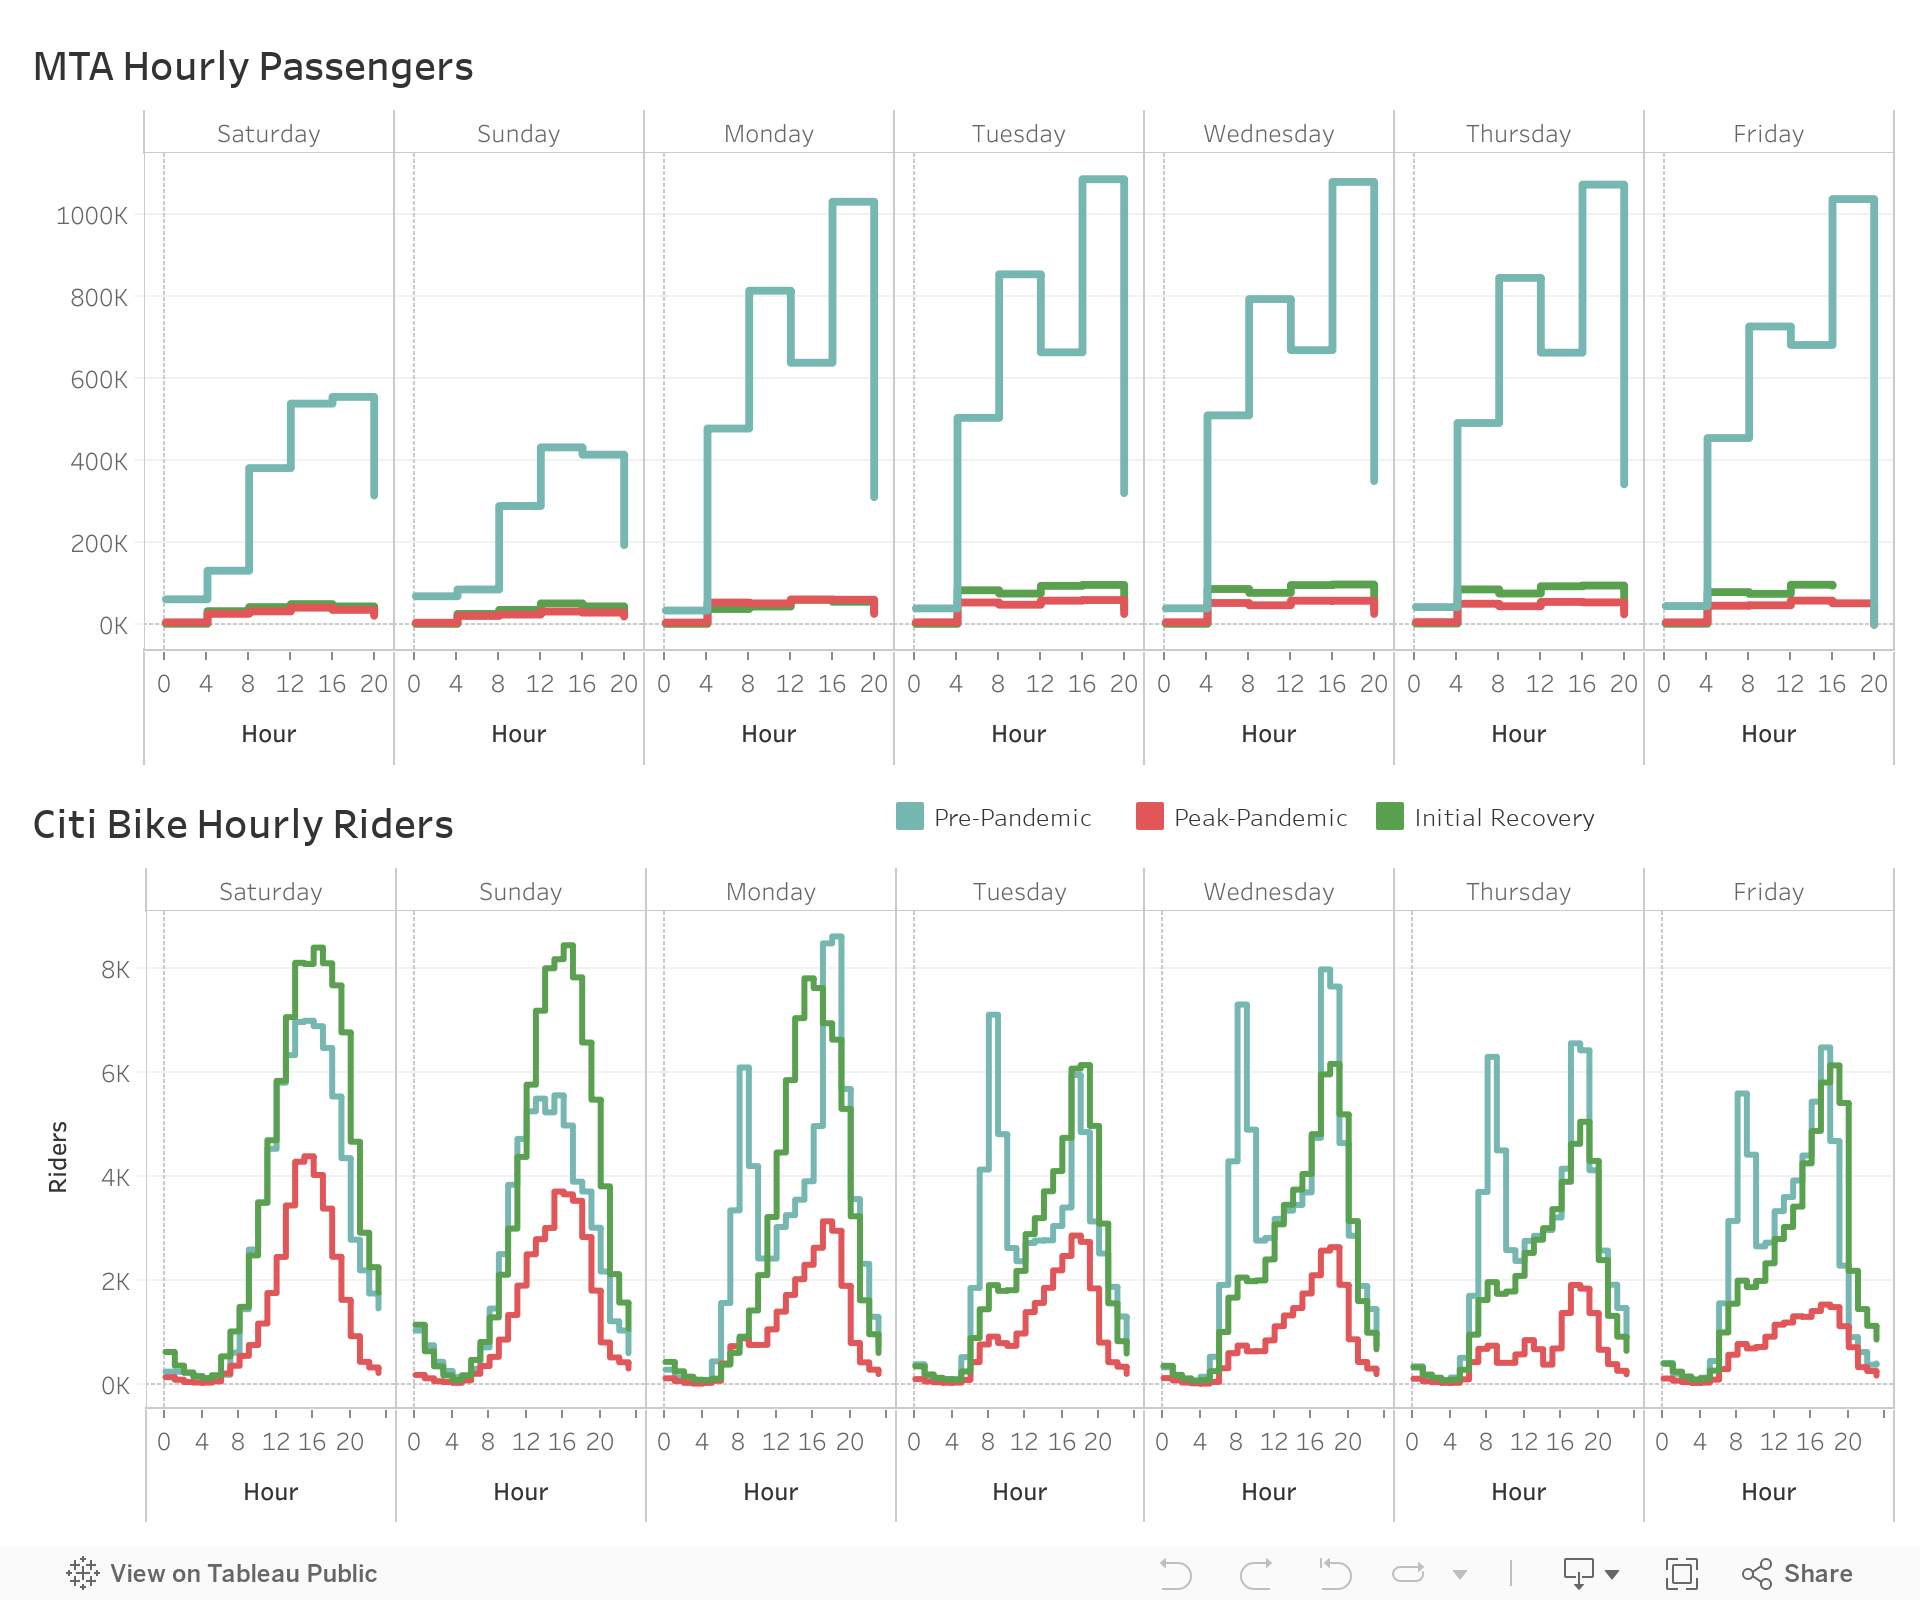
As shown in the graphs below, subway ridership in the initial recovery period (while very low overall) is still generally following a pre-pandemic temporal distribution, with surges during the typical weekday morning and late evening commuter peak periods. In contrast, Citi Bike ridership (which has nearly returned to pre-pandemic levels) is following a very different pattern than it did before the pandemic, with the typical morning commuter peak surge nearly eliminated, and trips increasing throughout the afternoon/early evening, while surging on weekends to higher levels than before the pandemic.
Citi Bike also tracks trip end times and, examining that detail, we found the duration of trips has changed significantly. Trips throughout the week show a median duration of 10 minutes pre-pandemic, to 16 minutes peak-pandemic, and 18 minutes in the initial recovery. This further indicates that the trips are for more leisurely, recreational purposes, rather than work commutes.
In addition, we have also found that new riders (people without annual memberships) are representing a greater share of Citi Bike ridership than they did before the pandemic, with the number of annual subscribers as a share of total riders dropping from 88% pre-pandemic, to 77% peak-pandemic, and 68% in the initial recovery. This indicates that travelers, whether on commute or leisure trips, are switching to biking in numbers not seen before. This data mirrors several of the findings our Chicago planning team shared recently regarding bikeshare usage patterns in that city.
While the warmer weather in late spring partially accounts for this uptick, examination of data from previous years shows that the seasonal variation does not fully account for this change and there has been a new, unique shift.
Trips Are Moving to Different Areas

Examining the detail on how trips are distributed within the subway and Citi Bike systems leads us to believe that the geographic distribution of Citi Bike stations, many of which are located near recreation areas that the subway doesn’t reach, have fostered the quicker recovery of bike share which can better accommodate the new origins and destinations people are flocking to as many still work from home and are traveling for non-work purposes.

When looking at the ranking of the ten busiest subway stations by the number of entering passengers in the chart below, there is only a slight, but interesting variation of busiest stations during the pre-pandemic, peak-pandemic, and initial recovery stages. Major transit hubs are ranked very high during all stages; however, several stations in Queens and one in Upper Manhattan have entered the top ten for the first time. While the specific reason for this is unknown, it is likely that these stations are located in neighborhoods where a high concentration of essential workers live, who have continued to commute to work throughout the pandemic. Conversely, a more extreme geographic distribution of Citi Bike’s riders has occurred. During the pre-pandemic stage the busiest stations were around major transit hubs, where riders were likely making “last mile” connections to employment centers. However, in the peak-pandemic and initial recovery stages, there was a dramatic shift, with some of the most popular Citi Bike stations now near the Hudson River, East River, and Central Park, supporting our belief that riders (many of them new) are using Citi Bike for recreation purposes and to access areas that subway doesn’t reach.
The Recovery Continues
While intriguing, this analysis is also a brief snapshot in time. As the city reopens further, we will continue to monitor subway and Citi Bike usage patterns. New data over the next several months will help indicate if these major shifts in mobility are representative of a new normal, or a temporary blip.
Data Sources
The most important transportation stories, direct to your inbox. Subscribe to TransCentral today.