Shifting Gears: Divvy Bikeshare + Ride-hailing in Chicago during COVID-19
This post is part of our comprehensive look at how COVID-19 is reshaping the mobility landscape. For more original research, project work, and thought leadership from the Sam Schwartz team, visit the COVID-19 Response + Analysis center.
Context
The COVID-19 pandemic and subsequent stay-at-home order have resulted in drastic changes to travel patterns in the Chicago area. With the recent release of Divvy and ride-hailing (e.g., Uber and Lyft) data for the first quarter of 2020, we wanted to examine how use of these new mobility options changed. We found that changes in ride-hailing varied greatly across the city, with the largest decreases occurring in the central business district and surrounding neighborhoods, while trips decreased by a much smaller percentage in many South and West Side communities. Divvy saw a fairly small decrease in overall usage, with many stations and communities increasing ridership over the previous year. The number of people purchasing day passes and single-ride options increased significantly compared to March last year, and the average duration of trips also rose.
Ride-hailing
Comparing publicly available trip data from ride-hailing companies from March 2019 and March 2020, we found that ride-hailing trips in Chicago dropped 47% (from 10 million trips in 2019 to 5.3 million trips in 2020). It should be noted that Chicago adopted a new fee structure for ride-hail trips beginning on January 6, 2020, which decreased fees for shared trips but increased fees for solo trips and trips in downtown. The drop in trips accelerated dramatically during the second half of March, once schools closed and the stay-at-home order went into effect. Across all of March 2019, there were an average of 3,500 ride-hailing trips per hour. During the second half of March 2020, the number of trips per hour sunk to 700—an 80% drop. The proportion of rides that were shared (e.g., Uber Pool and Lyft Line) fell by 56% for all of March.
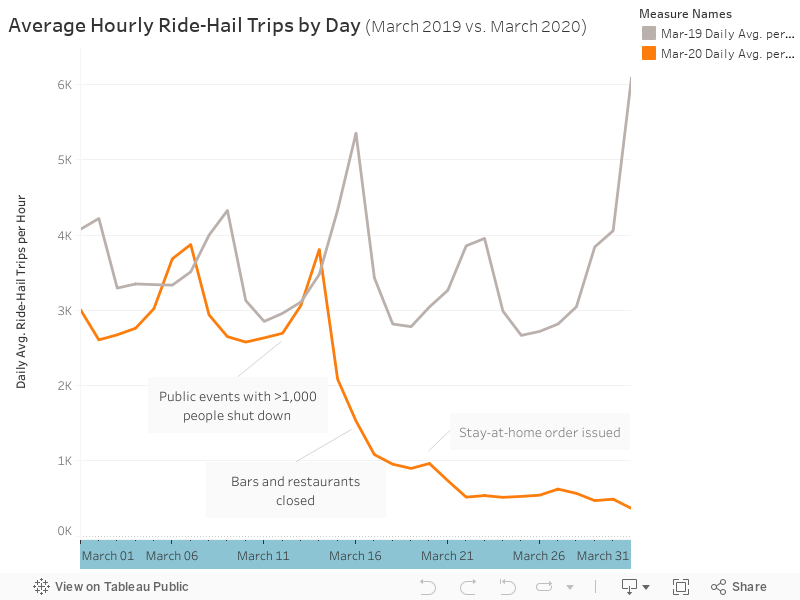
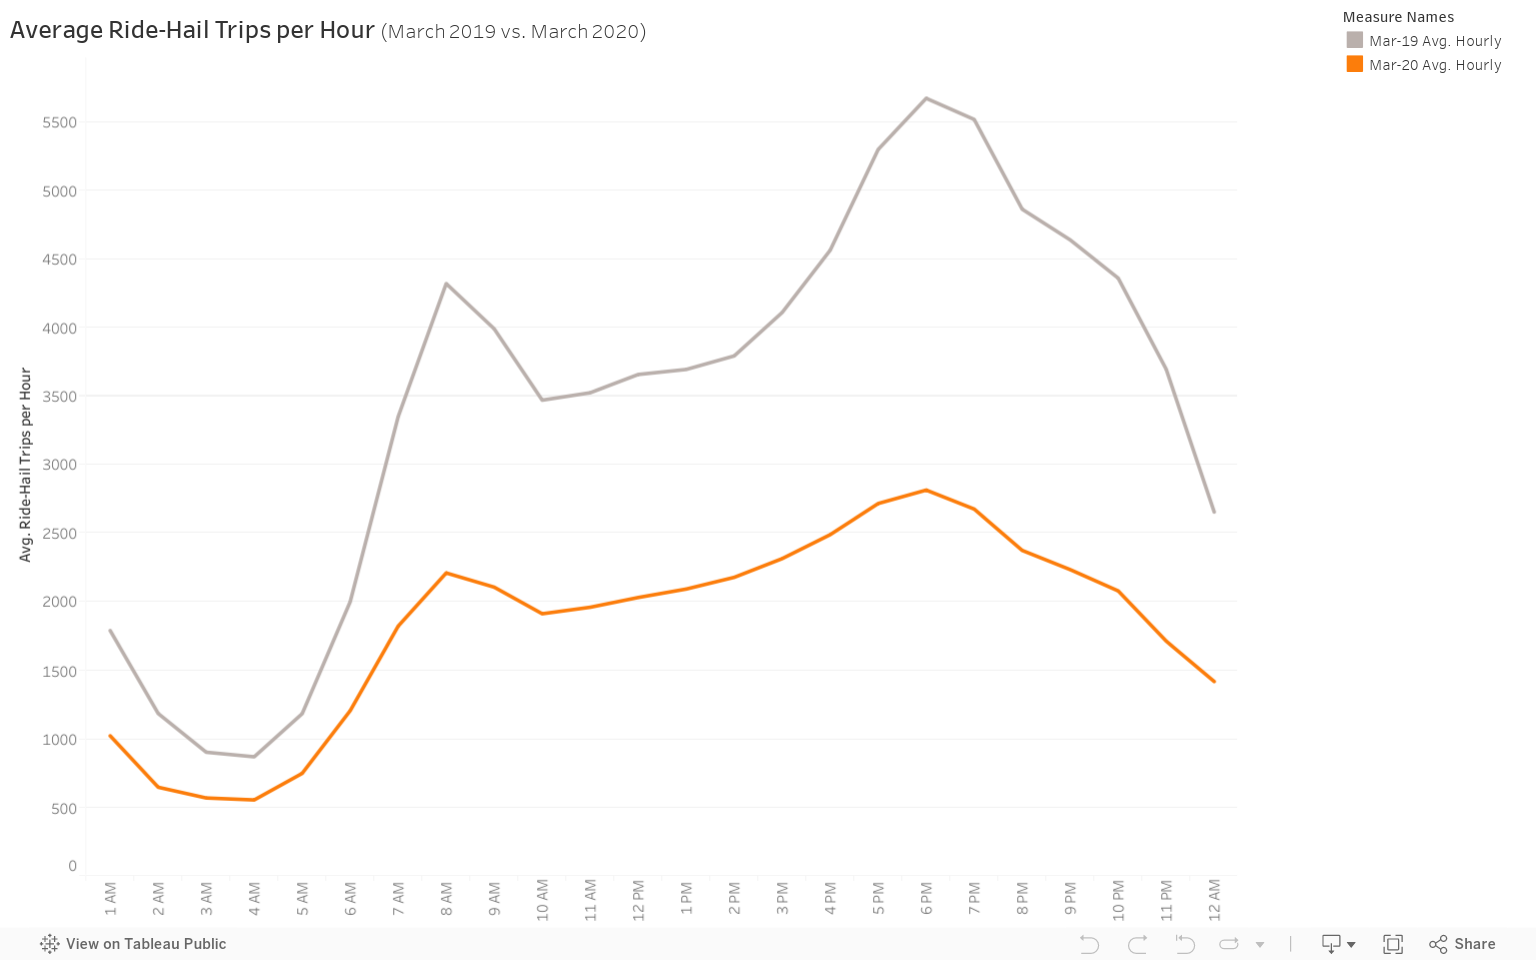
The times of day when people used ride-hailing services also noticeably changed. In March 2019, trips peaked significantly during the morning and evening rush hours. In March 2020, ride-hailing trips were spread more evenly across the day, with demand remaining fairly consistent from 7am to 11pm. The less defined rush hour peaks in ride-hailing trips may reflect different patterns in work hours among many essential workers who are still using ride-hailing services.
A WBEZ analysis of transit ridership during March 2020 found that CTA ridership has decreased much less dramatically on the South and West Sides compared to other areas of the city, and CMAP has shown that the number of trips beginning in census tracts with lower median household incomes have not declined as much as higher-income tracts. We also know that essential workers, who have to travel more, are disproportionately low-income, people of color in the Chicago region. These disparities are also apparent in the ride-hailing data: the community areas that experienced the smallest decreases in ride-hailing trips (and one community area that saw trips increase) were on the South and West Sides. The largest decreases in trips were in the central business district and surrounding neighborhoods, with Armour Square (which includes Chinatown) experiencing a 60% drop in trips. The map below shows the percent change in ride-hailing activity for each of Chicago’s 77 community areas comparing March 2020 and March 2019.
Divvy
We also analyzed Divvy trip data for March 2019 and March 2020. Compared to ride-hailing, transit, and private vehicles, Divvy experienced a relatively small 15% decrease in total trips. For March 2020, users made 140,207 trips on Divvy bikes, compared to 165,611 trips in March 2019.
The decrease in trips was less drastic due in part to strong ridership numbers during the first half of the month. Through March 15, Divvy ridership increased 56% over 2019 (104,158 vs. 66,648 trips). This may have been partially due to weather (the average high temperature was 50°F in 2020 compared to 37°F in 2019) and could also indicate some early behavior shifts towards transportation options that allow for greater physical distancing.
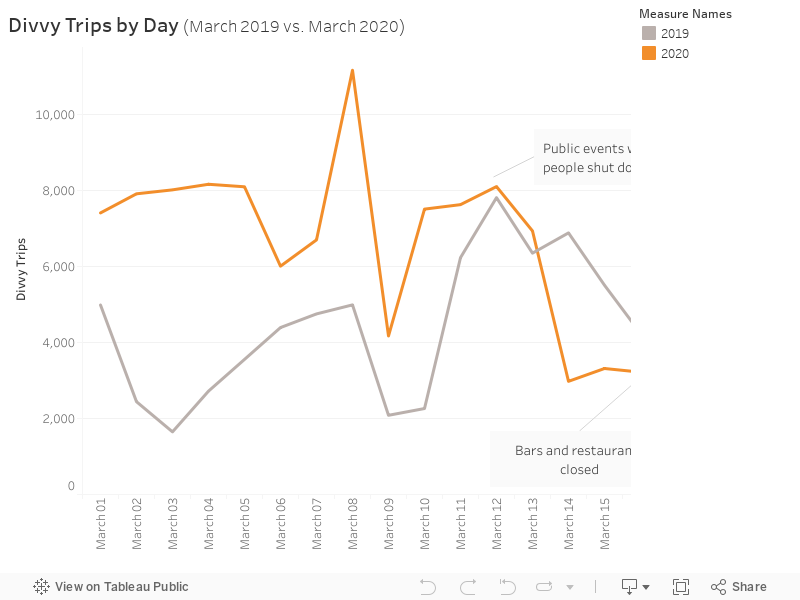
While ridership decreased slightly overall for March 2020, the number of trips made by users purchasing a day pass or single ride increased 56% (15,923 in March 2019 to 24,615 in March 2020). Considering the absence of tourists this year, the increase in casual riders may indicate essential workers testing new ways to get to work and residents looking for ways to get exercise and time outdoors while following distancing guidelines.
The duration of Divvy trips also increased this year: the average trip lasted 24 minutes in March 2020 compared to just 13 minutes in March 2019. As a result, riders spent 52% more time riding Divvy bikes this year than last year and got an additional 20,000 hours of exercise.
Looking at individual Divvy stations, those in the Loop and near Union Station and Ogilvie Transportation Center saw the largest decreases in trips. Across the City, 222 stations (39%) saw more trips in 2020 than in 2019. The map below shows the change in activity at individual Divvy stations (note: 575 stations had matching IDs and names across the 2019 and 2020 data).
20 of the 45 community areas in which Divvy operates stations saw trips increase in March 2020. While the geographic difference in Divvy usage was not as clear as with ride-hailing, eight communities on the South and West Sides saw the greatest percentage increase in trips from 2019 to 2020: Grand Boulevard, South Shore, Greater Grand Crossing, South Chicago, Chatham, Kenwood, West Englewood, and North Lawndale. The map below shows the percentage change in Divvy trips from 2019 to 2020 for Chicago’s community areas.
Conclusion
Divvy and ride-hailing services didn’t exist in Chicago ten years ago but have quickly become important components of the city’s transportation system. Chicagoans’ travel habits have changed as a result of the pandemic, but both Divvy and ride-hailing data show these changes look different across the city. While many residents have been able to work from home and reduce their movement, ride-hailing data emphasizes how others—especially those on the South and West Sides—still have to commute and move about the city.
As Chicago and Illinois reopen, workers return to jobs, and activity increases, there are many questions around how people’s travel behavior may change. Will people prefer traveling alone in their cars? Will those without cars choose to bike or use Divvy more? Will transit ridership bounce back quickly or slowly with time? How will behavior vary across neighborhoods? We can’t answer these questions now, but we know that continuing to closely monitor the data over the coming months will be critical to ensure Chicagoans in every neighborhood have safe, affordable options for getting around.
Stacey Meekins, Alex Hanson, Jamie Osbourne, and Mark Bennet contributed to this post.
Want more vital transportation stories? Subscribe to TransCentral today.